Introduction
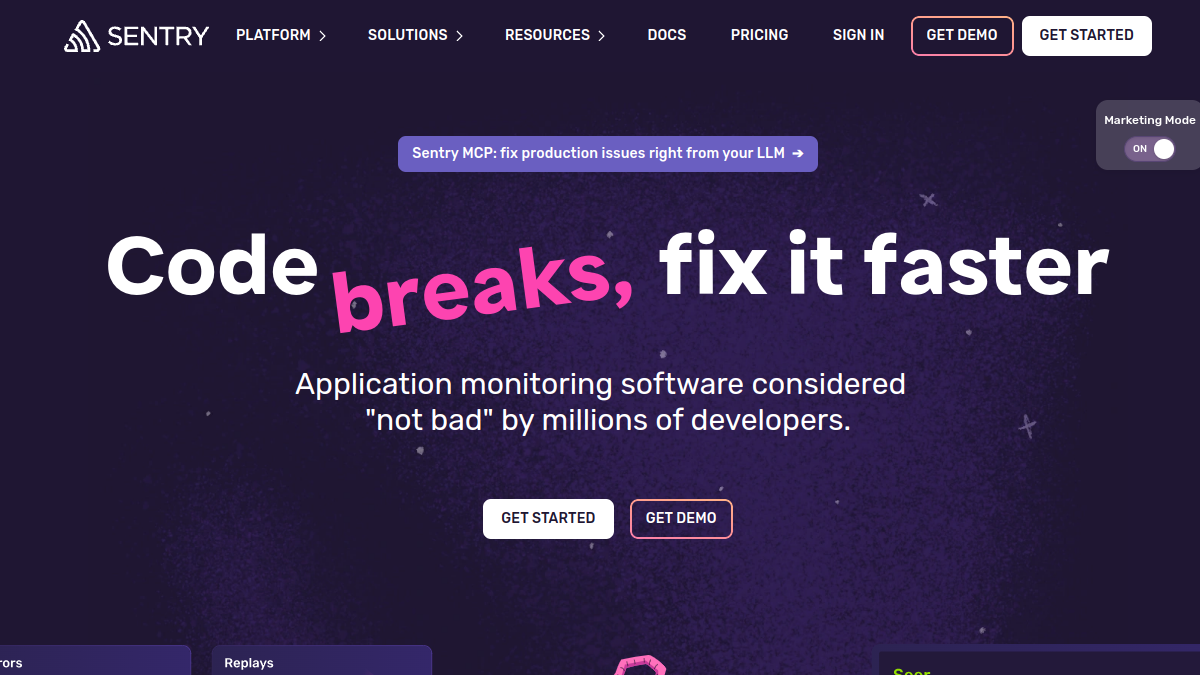
Sentry is an application performance monitoring and error tracking platform designed for developers and software teams. It provides visibility into errors, logs, replays, traces, profiles, and metrics, all connected by the same trace. The platform aims to help teams see errors clearer, solve issues faster, and continue learning continuously.
What is Sentry?
Sentry is a developer-first application monitoring platform that offers error monitoring, performance tracing, session replay, logs, metrics, profiling, cron monitoring, uptime monitoring, and AI-powered debugging. It supports a wide range of programming languages and frameworks, including JavaScript, Python, Node.js, React, .NET, Go, Swift, Ruby, PHP, Laravel, ASP.NET Core, Spring Boot, Vue, Solid, Svelte, Astro, Next.js, Angular, Android, iOS, Flutter, and React Native. Sentry can be integrated via SDKs with minimal setup, often requiring only a few lines of code.
What makes Sentry stand out?
- Developer-first approach with easy SDK installation, often in five lines of code or one command.
- Connects errors, logs, replays, spans, profiles, and metrics through a single trace for full context.
- Includes Seer, an AI debugging agent and code reviewer that analyzes signals to explain why code failed and generates merge-ready patches.
- Agent tracing helps catch unexpected output issues, bad tool calls, and visualize spend and performance across AI agents.
- Integrates with GitHub, Slack, Jira, Linear, and coding agents via Sentry's MCP server.
- Automatically maps incidents to releases, PRs, and owners.
- Built to be secure and designed not to get in the way, with industry-standard security practices.
Who is it for?
- Developers and software teams looking to monitor and fix application issues.
- Web and full-stack development teams.
- Mobile app developers for crash reporting.
- Game developers for crash reporting.
- Teams building AI applications and agents.
- Enterprises and startups seeking application observability.
- Ecommerce platforms requiring performance monitoring.
- Organizations using OpenTelemetry.
What can you do with Sentry?
- Monitor application errors and performance in real time.
- Debug 500 errors, trace slow requests, and replay fetch() failures.
- Catch slow queries, N+1s, and request timeouts.
- Use Seer to automatically root-cause issues and generate fixes.
- Track agent performance and spend with agent tracing.
- Correlate PRs against error and performance history to catch regressions before shipping.
- Integrate with development tools like GitHub, Slack, Jira, and Linear.
- Get started quickly with SDKs for many languages and frameworks.
How does Sentry work?
Sentry works by integrating SDKs into applications. Developers install the SDK, often with a single command or a few lines of code, and configure a DSN. The SDK captures errors, performance data, and other signals, which are sent to Sentry's platform. Sentry then correlates these signals using a shared trace, providing context such as logs, commits, traces, and stack traces. This context powers features like error monitoring, tracing, session replay, and AI-driven debugging with Seer. Sentry also integrates with tools like GitHub, Slack, Jira, and Linear to bring context into the development workflow.
Pricing
Sentry offers both free and paid plans. The free plan allows getting started at no cost, while paid plans provide additional features and capacity. For detailed pricing information, visit the Sentry website.
Alternatives
Alternatives to Sentry include other application performance monitoring and error tracking tools. However, specific alternatives are not listed in the source text.
FAQ
What is Sentry?
Sentry is an application performance monitoring and error tracking software that helps developers see errors clearer and solve issues faster.